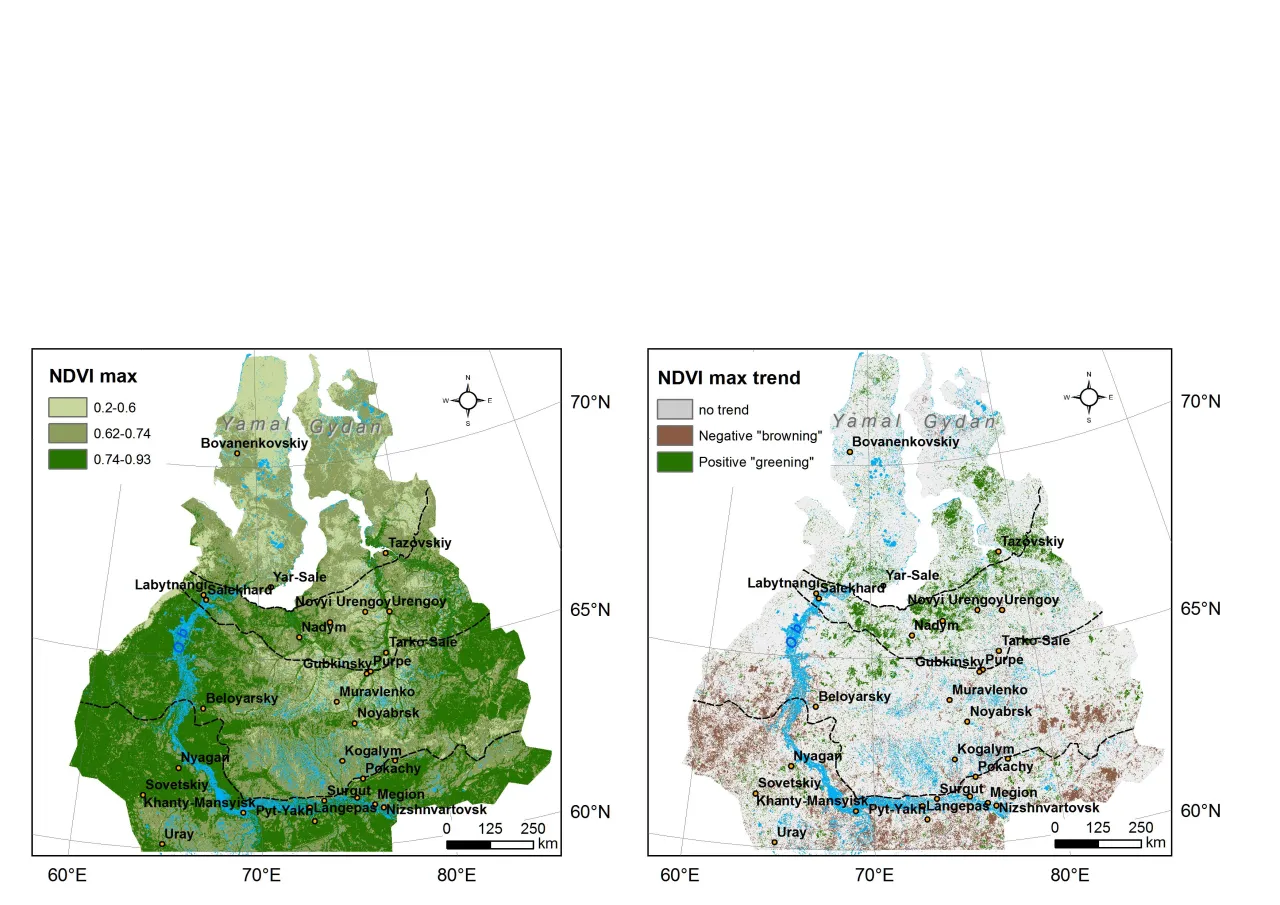
The map of the NDVI change in the Northern West Siberia

Explanation. The map of the annual maximum NDVI was obtained from the analysis of the MODIS NDVI 250 m resolution data over 2000-2014. The NDVI max trends computed using the ordinary least square method. Only the statistically significant at p<0.05 trends are shown. More detailed explanation could be found in Esau, I., Miles, V., Miles, M., Davy, R., Kurchatova, A., 2016: Trends in the normalized difference vegetation index (NDVI) associated with urban development of Northern West Siberia, Atmospheric Chemistry and Physics, 16, 9563-9577, doi:10.5194/acp-16-9563-2016
Usage. The map could be used for the regional enviromental management and zonning by the administration and economic subjects. The map original resolution is at 250 m (25 Mb) could be downloaded [here].